


Many business applications, data management systems, project management tools, and dashboards rely heavily on table grids to display and manage data. In data-heavy applications, table grids are often a central component.
Table grids are a fantastic user interface component that can handle and present large volumes of data in an easy-to-understand and navigable manner. Their versatility also allows for performing complex data operations, including sorting, filtering, and pagination.
Building table grids can be complex and challenging for frontend developers due to a variety of reasons:
Data Variability: Table grids often need to display various types of data with differing structures and content. This requires handling dynamic data rendering, sorting, filtering, and grouping, which can be challenging to implement in a consistent and efficient manner.
Performance: Rendering large datasets efficiently is crucial for a responsive user interface. Optimizing rendering, pagination, and handling real-time updates without causing performance issues can be difficult.
Responsive Design: Making table grids responsive across different devices and screen sizes requires careful design and development to ensure that the data remains readable and usable.
Accessibility: Ensuring that table grids are accessible to users with disabilities is essential. This includes proper labeling, keyboard navigation, and compatibility with assistive technologies.
User Interactions: Implementing features like sorting, filtering, selection, and inline editing can be complex. Coordinating these interactions seamlessly while maintaining a smooth user experience adds to the complexity.
Cross-Browser Compatibility: Different web browsers may render elements differently, so ensuring consistent behavior and appearance across various browsers can be challenging.
Data Formatting: Tables often display various types of data, such as text, numbers, dates, and images. Formatting and displaying these data types appropriately can be tricky.
Customization: Many applications require the ability to customize the appearance and behavior of table grids according to the application’s branding and user preferences. This adds an additional layer of complexity.
State Management: Handling the state of the table grid, including filters, sorting orders, and selected rows, requires robust state management to ensure data consistency and maintain a good user experience.
Internationalization: If an application needs to support multiple languages and regions, handling localized content within the table can be challenging.
We’ll be covering building of table grids with React and DronaHQ, focusing on the following key features:
Sorting
Filtering
Pagination + page size
Edit cells
Creating a table on React

Before diving into the nitty-gritty of building our table grid, we need to set up a few essential libraries that will help us achieve our goals.
React Native Paper: This fantastic library provides an array of UI components tailored for React Native, and among them is the DataTable component we’ll be using for our table grid.
React Native DataTable: Extending the functionality of the DataTable component, this library equips us with additional features like sorting, filtering, and pagination.
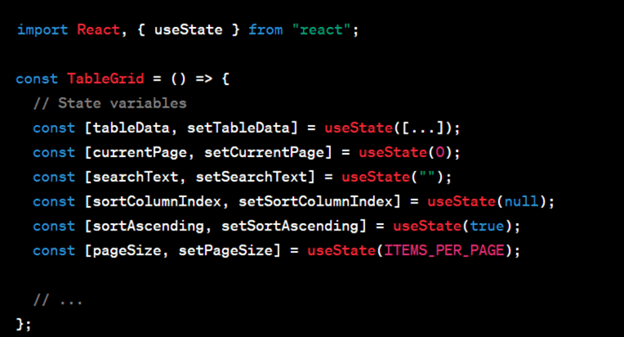
1. State Management with React Hooks: The component uses React’s “useState” hook to manage various states such as “tableData”, “currentPage”, “searchText”, “sortColumnIndex”, “sortAscending”, and “pageSize”. The “useState” hook allows functional components to have local state without using class components.
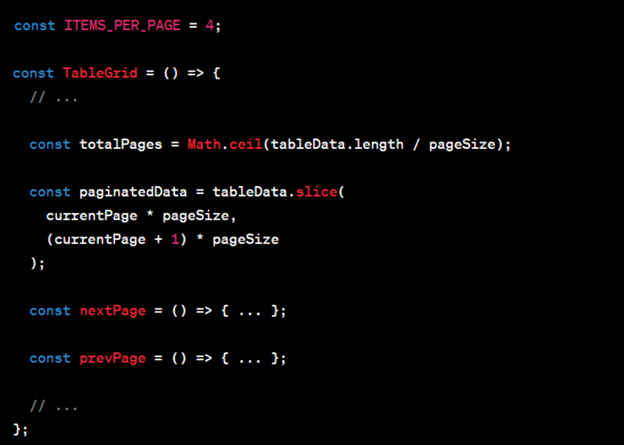
2. Data Pagination: The component implements data pagination, allowing users to navigate through different pages of data. The “nextPage” and “prevPage” functions handle page navigation, and “currentPage” and “totalPages” help determine the current page and the total number of pages. The “pageSize” state allows users to change the number of items displayed per page.
3. Data Sorting: The component allows users to sort the data based on different columns (Name, Age, Occupation) in ascending or descending order. The “handleSort” function sorts the data based on the selected column. The “sortColumnIndex” state keeps track of the column on which sorting is applied, and the “sortAscending” state determines the sort order.

4. Data Filtering/Search: The component provides a search input for users to filter the displayed data based on the entered text. The “handleSearch” function updates the “searchText” state and filters the data accordingly. The “filteredData” state stores the filtered data based on the search text, and the “paginatedFilteredData” state contains the filtered data for the current page.

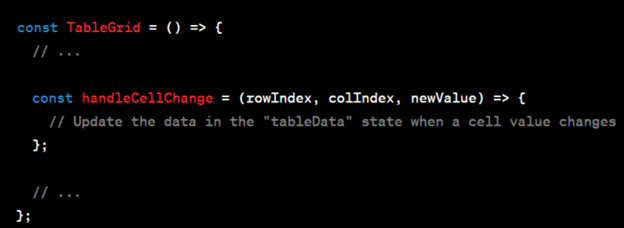
5. Editing Cell Data: Each cell in the table is represented by a TextInput component, which allows users to edit the data in the cells. The “handleCellChange” function updates the “tableData” state when a cell value is modified. It calculates the correct index in the data array based on the current page and updates the specific cell data accordingly.
6. Styling with React Native StyleSheet: The component uses React Native’s “StyleSheet.create” to define the styling rules for various elements such as container, searchInput, headerRow, headerCell, row, cell, and pagination components. This helps in maintaining a clear separation between the presentation and logic in the component.

7. React Native Components: The component makes use of various React Native components like View, Text, Pressable, TextInput, and Picker to build the UI. These components provide a native-like look and feel to the application and ensure cross-platform compatibility.

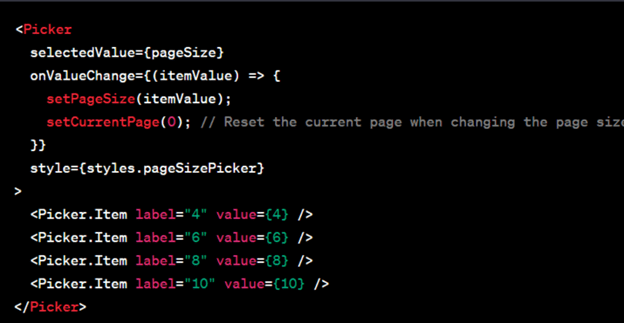
8. Pagination and Page Size Options: The component includes pagination controls that allow users to navigate to the previous and next pages of data. Additionally, it provides a Picker component to change the page size dynamically, enabling users to choose how many items they want to view per page.
Creating a table on DronaHQ

While the Table Grid is a formidable tabular UI component, DronaHQ distinguishes itself by offering a pre-constructed table grid control embedded with essential CRUD capabilities such as adding, editing, and deleting.
The Table Grid UI control by DronaHQ presents an extensive range of table functionalities encompassing diverse data types, such as files, URLs, Geolocation, DateTime, and more. These options empower users to include and peruse more intricate details.
Through this functionality, users gain the ability to access information from various data sources (such as Postgres, Mongo, Firebase, Google Sheets, etc.), merge data across different sources (like combining customer ticket data from Zendesk with order data from MySQL), and seamlessly manipulate distinct data attributes within a unified data table.
This table grid confers users to effortlessly link and use all their data within a singular platform, enabling the creation of uncomplicated applications.
How to configure Table Grid in DronaHQ
Step 1: Create an account on DronaHQ, or if you already have an account sign in to the studio
Step 2: Open any app you have already created or have access to, or create a blank application.
Step 3: Open the control section from the left panel, and search for the table grid control. Then just drag and drop it onto the screen.
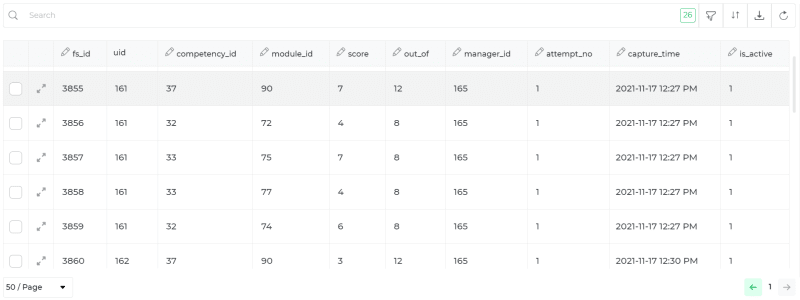
Once you have added a table grid to the app screen, you can now bind data to it.
After the data is fetched into the table let’s see how filtering, sorting, pagination, and editing the cells works in DronaHQ.
1. Filtering & Sorting
DronaHQ gives you a straightforward solution for implementing filtering and sorting within a table. There’s no requirement to write code or perform any complex tasks.
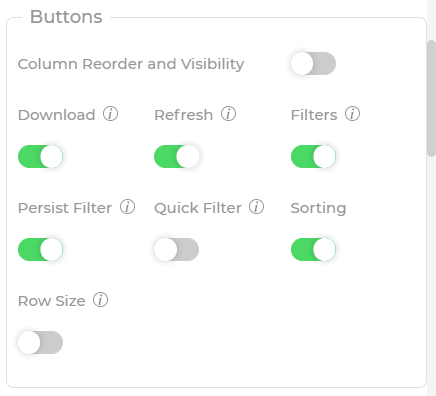
For implementing sorting in the table grid, you just need to toggle on the Sorting property. This empowers end users to establish sorting criteria that persist even when they return to the screen, as the sorting preferences become the default.
To activate filters within the table grid, simply toggle on the Filters property. This enables users to set filter conditions based on the data types assigned to various columns. Notably, distinct user interfaces are presented for varying data types, enhancing usability.
2. Pagination
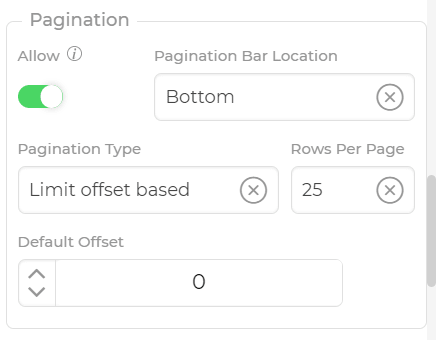
For utilizing this functionality, you’ll need to activate the “Allow” option within the pagination group. Additionally, your API must have pagination support to make use of this capability. DronaHQ accommodates two pagination methods: limit offset-based and cursor-based. You’re also given the flexibility to determine where the pagination bar is positioned through the Pagination Bar Location property setting.
Learn more about it here
3. Edit cells
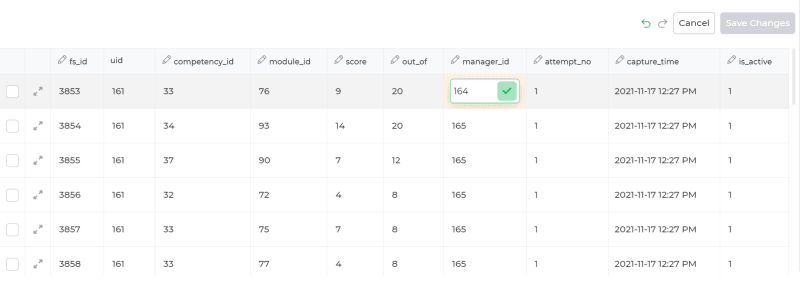

Once you’ve linked data to the table grid control, you gain the ability to enable column editing and perform real-time data edits directly within the respective cells. To achieve this, navigate to the Property section where you’ll find a dropdown labeled “Choose columns that will be editable.” Here, you can select the specific columns you wish to render editable.
Modifications can now be applied to the rows within the editable columns. Following any alterations, a “Save Changes” button becomes available, complete with a trigger dependency that facilitates the initiation of an event to record the edits within the backend database. For further insights on editing rows within the table grid and its practical applications, additional information is available here.
Simplifying Data Management with DronaHQ and React
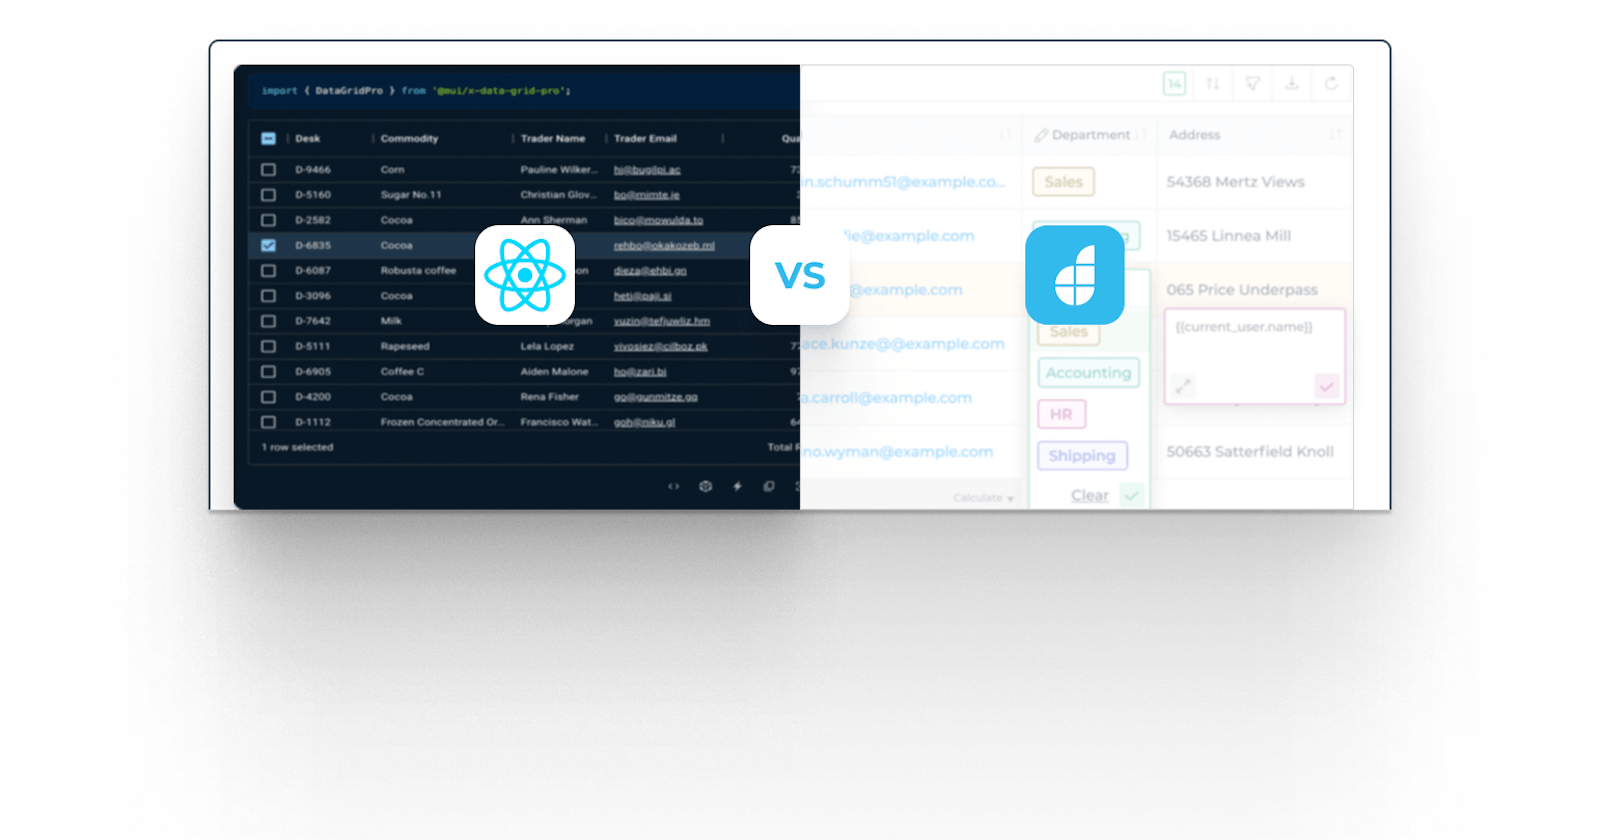
In this comparison between building tables using React and DronaHQ, we’ve seen two approaches. In the React part, we dived into coding and saw how things can get complex. On the other hand, DronaHQ offered a quicker path. With just a toggle, you could set up filtering, sorting, pagination, and even edit cells on the spot.
React gives you precise control but takes more time and effort. DronaHQ, however, makes things easy. You choose between customization (React) and customization with convenience (DronaHQ). Whether you code with React or go for DronaHQ’s simplicity, the end goal of managing data effectively is achievable.
Overall, the challenges and complexity associated with building table grids stem from the need to balance various factors such as data representation, performance, user experience, and customization while ensuring the final product meets the requirements of the application and its users.
Get started building tables on DronaHQ now. Sign up for free!